Using LC0's WDL to Analyze Games
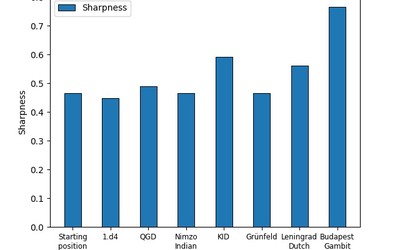
I always like to look at the analysis graph of a chess game. It gives a nice overview of how the game went and what the turning points were. However, there are a lot of things it doesn't show. One of them being the kind of game it was. There is a big difference between a fighting draw and a game where neither player tries something. So I decided to if I could generate more insightful game graphs using LC0's WDL.I originally saw such graphs as an illustration of Leela's WDL evaluation in a blog post by the dev team. This post lead to my idea to use LC0 to evaluate the sharpness of positions.
I thought again about this post when I tried to think of ways to analyze games with engines only in a more insightful way to humans than wild evaluation swings justified by difficult to comprehend lines. Getting a good overview of the game was my first goal.
Comparing WDL and centipawns
The main advantage of using the WDL is that it contains more information and therefore should be more insightful. I analyzed many different games and looked at a lot of different graphs. The differences weren't as striking as I had hoped, but it was still exciting to compare them.
The first game I want to look at is Tal-Kobelnts, 1957. This was a wild game typical of Tal's style.
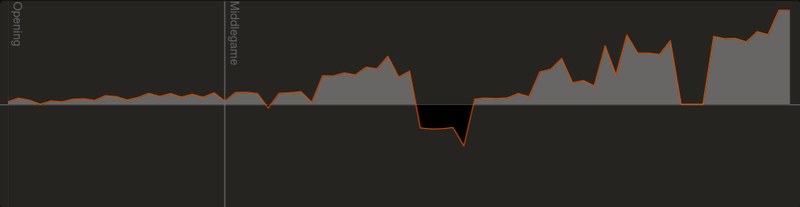
The centipawn graph looks fairly mundane:
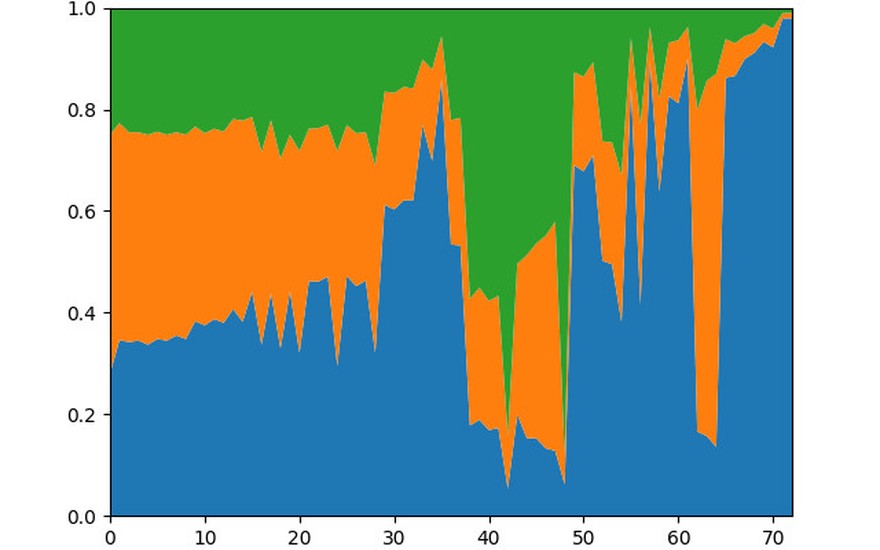
In comparison to that, the WDL graph looks much more wild:
 Note that the height of the blue region shows the win percentage for White, the green region is the win percentage for Black and the orange region is the draw percentage.
There are a lot of different spikes for both sides, but I want to look at the overall picture.
Looking at the opening, the centipawn graph looks fairly normal, White had a small advantage, made some inaccuracies, and then Black made a mistake.
In the WDL graph, the drawing rate is decreasing slowly, meaning that the position gets sharper with every move. This certainly fits with my impression of the game. Black's mistake is then put into a different light: it's clear that the position is quite sharp and that Black's error certainly isn't completely unforced.
One different situation in which I had hoped that the WDL graph would show a much better overall picture is long grinds. As an example, I picked the rapid game Ponomariov-Carlsen, 2010
Starting on move 43 we have a rook ending which should be equal but Black can try to push for the win. This is the kind of thing that I wanted to see on the WDL graphs.
The centipawn graph for this game doesn't look very exciting:
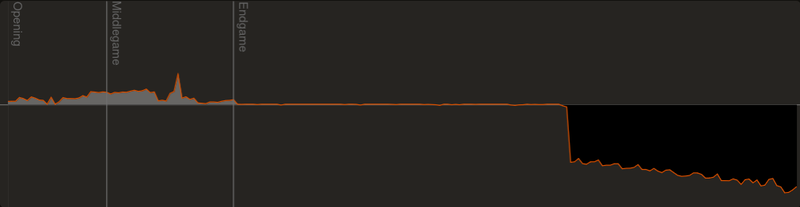
After the ending is reached, it looks just like White blundered in an even position. In reality, White was under pressure for a long time and had only one drawing move.
I hoped that the WDL graph would look very different but after generating it, I was a bit disappointed:
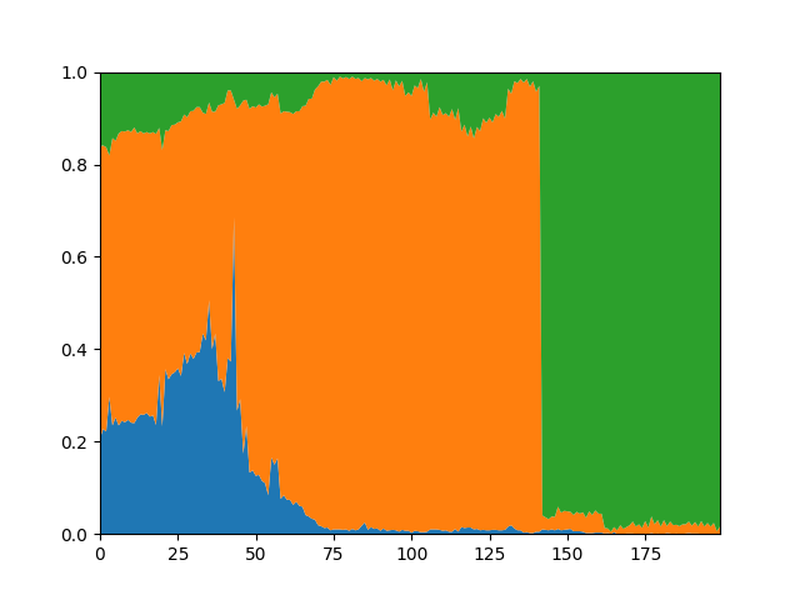
While Black has some winning chances between ply 100 and 125, most of the graph looks the same as the centipawn graph.
I would guess that the "problem" is that the position is a simple draw for engines, even though humans have more trouble with it.
Comparing Different Nodes
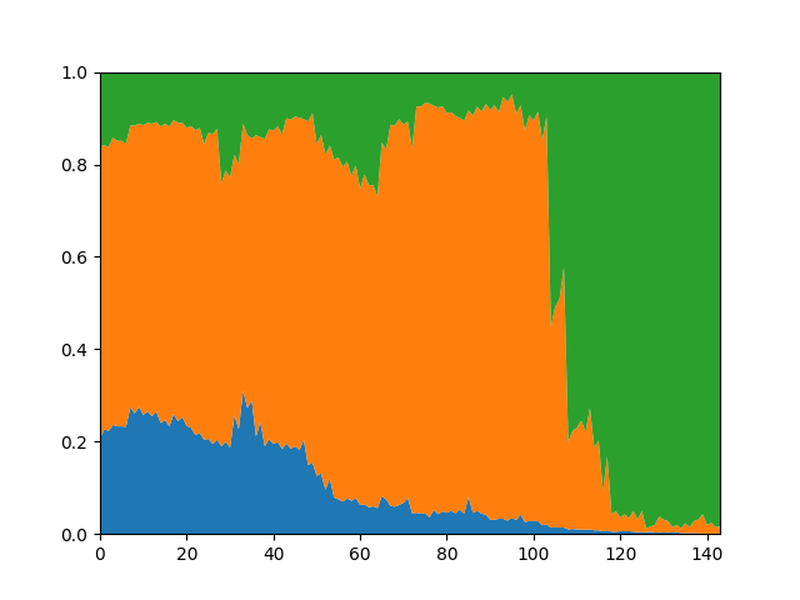
Whenever I run such an analysis, I'm a bit unsure about the number of nodes per move to pick for the analysis. More nodes give a more accurate analysis but in some sense, it's further removed from human play. Also, the time it takes to run the analysis shouldn't take too long. So I analysed each game using 1, 10, 100, 1000 and 10000 nodes per move. In general, the more nodes were used, the more extreme the graphs got. Here is an example from the game 12 of the most recent world championship match, Ding-Nepomniachtchi, 2023
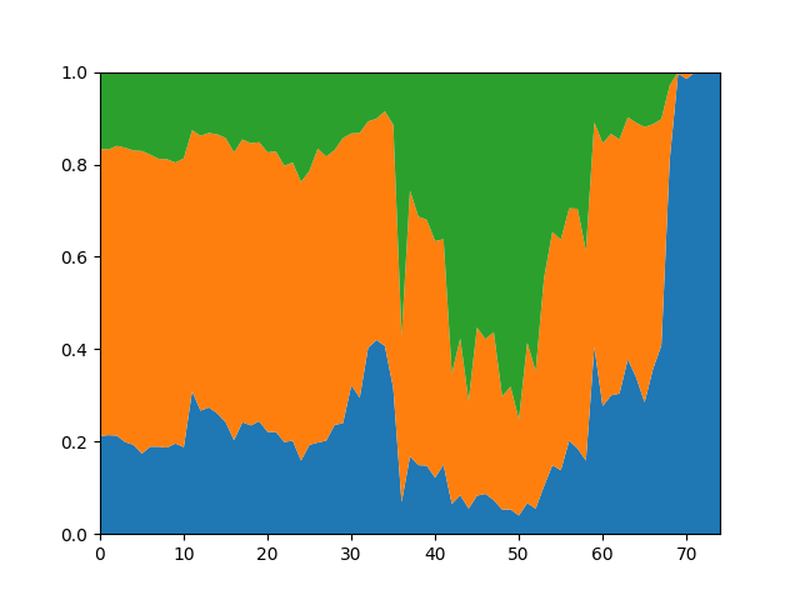
Analyzing the game with 1 node per move results in the following graph.
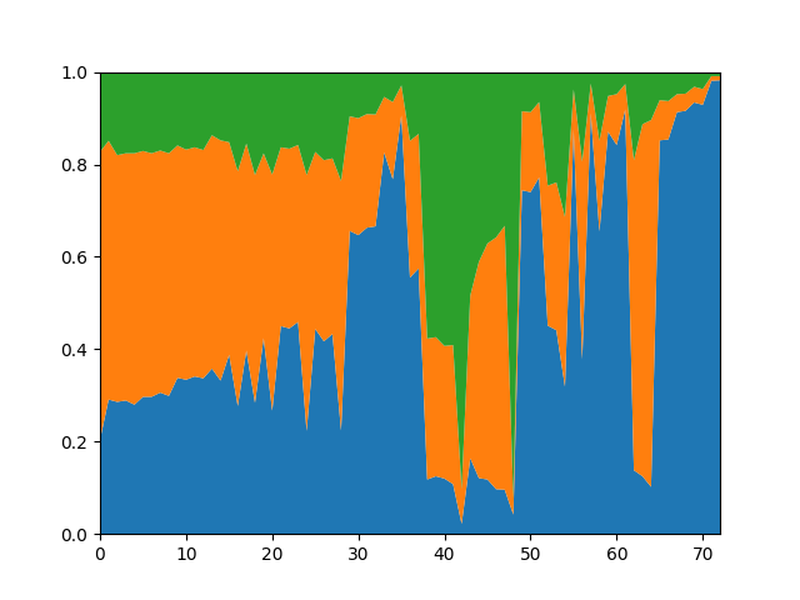
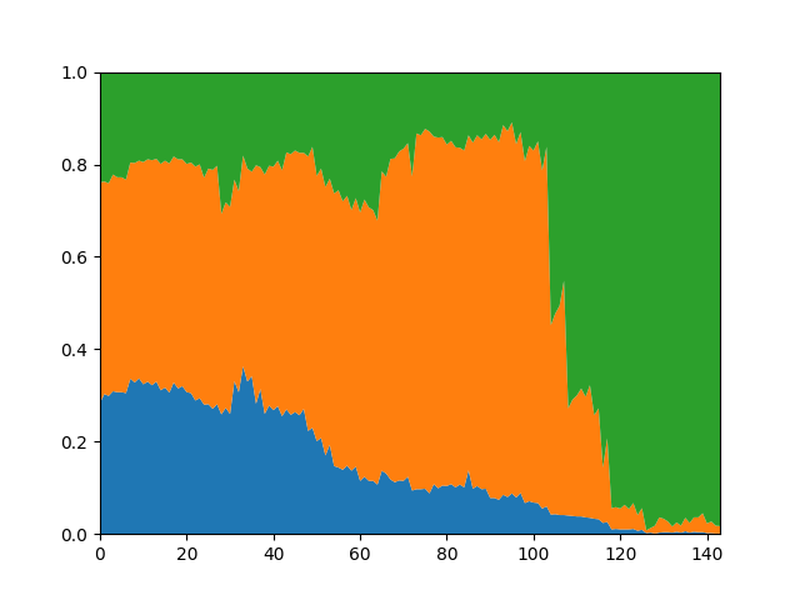
Compare this with the spikier graph when the game is analyzed with 10,000 nodes per move:
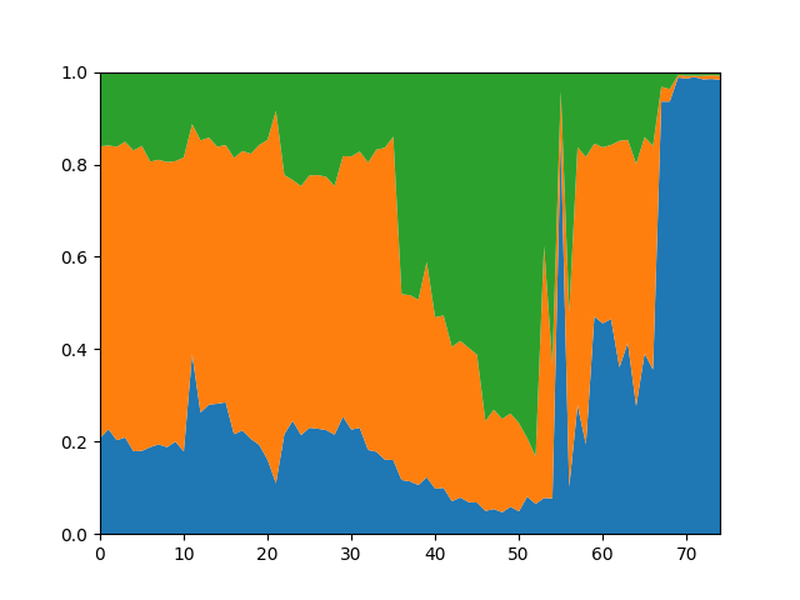
It makes sense that the graph gets spikier with more nodes since the engine will pick up on any small inaccuracy and if a position is clearly better, the engine will win it with a higher probability if it can analyze for longer.
Notice also the spike at move 29 (play 58) which can be seen in the graph for 10000 nodes but not in the graph with 1 node. I would suspect that with only 1 node (so no calculation at all) Leela missed a tactical point in the position, so the oversight goes unnoticed.
Analyzing with more nodes is obviously more accurate, but I always have the fear that the evaluations are then too far removed from the capabilities of humans. So generally I try to find a middle ground.
Note that in all graphs where I haven't mentioned the node count, I used 10,000 nodes per move.
Trying Contempt Values
Somewhat recently, there was an update to LC0 which introduced WDL contempt. With this feature, you can calibrate the WDL to a specific Elo and also specify the rating difference between the two players. GM Matthew Sadler has made some great youtube videos using this to analyse openings. I thought that looking at the game overall might also be interesting.
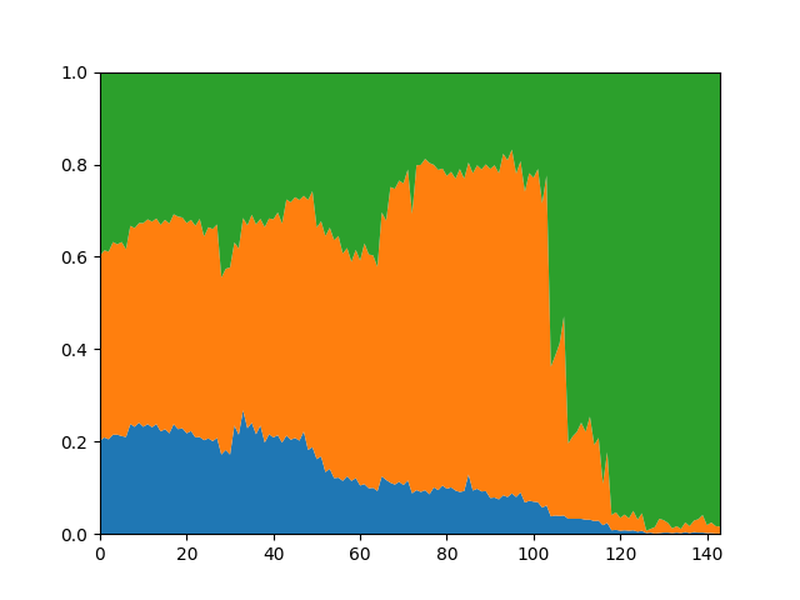
I used this feature to look into the game Vidit-Carlsen, 2023 from the 2023 World Rapid Championship.
The WDL graph of the game without any additional settings looks like this:
White of course started with a slight advantage but soon White's winning chances started to dwindle. Then White made a mistake and Black was winning.
After setting the Elo to 2800 (using WLDCalibrationElo) the graph looks like this:
Notice that the overall picture hasn't changed much, but the drawing rate is reduced which makes sense because even super GMs are more likely to make mistakes than LC0 on full strength.
By setting the Contempt to 100 and the contempt mode to "balck_side_analysis", Leela recalibrates the WDL to take into account that Black is rated 2800 and White 2700.
Again, the overall shape hasn't changed much but now Black's winning chances have increased while White's have decreased compared to the WDL without the contempt.
It would be interesting to look at the contempt in more detail in the future and see if the rescaled WDL is a better approximation for the winning probability in real games.
If you enjoyed this post, check out my substack and my other posts about chess engines.
More blog posts by jk_182
The Candidates in 13 Graphs
Looking at stats from the 2024 Candidates tournament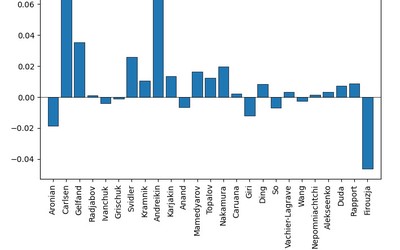
Calculating the Sharpness of Different Players
How well does the sharpness score agree with the human intuition about sharpness?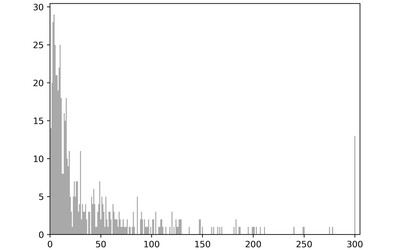
Centipawn Loss Distribution
I'm always interested in values and stats calculated by engines that can give an overview of a chess…